from SRS Rocco:
 If you are a precious metals investor, you need to see this chart. Matter-a-fact, this is the first time (to my knowledge) in the history of precious metals analysis that the information in this chart has been made public. One look at this chart and the investor will see the the huge difference between the cost to produce the precious metals.
In addition, the information in this chart will show why the peak of primary gold production will occur before the peak of primary silver production. However, global silver production will likely peak soon after world gold production. Thus, individuals understanding the difference, will likely enjoy a rewarding investment strategy most are currently unaware.
As I have mentioned time and time again, ENERGY IS THE KEY to the value of the precious metals. This goes well above and beyond the percentage of raw energy (oil, natural gas, coal, hydro & nuclear) consumed in the production of an ounce of gold or silver. Unfortunately, investors do not realize that 90-95% of the value of an ounce of gold or silver is directly related to the amount of energy consumed IN ALL FORMS and IN ALL STAGES in the their production.
Labor is a form of energy. Upper management pay, is a form of energy (highly skilled energy). The materials consumed in the gold and silver mining industry get their value from the energy consumed IN ALL FORMS and in ALL STAGES of their production-transportation-distribution. The mining equipment used in the production of gold and silver also get their value from all the energy consumed in their manufacture (in all forms and stages).
While the market understands that energy is large percentage of the cost to produce gold or silver, they fail to realize LABOR, MATERIALS and EQUIPMENT are all “Energy Derivatives.” Even though labor, materials and equipment are listed as different itemized costs on the precious metals mining company’s balance sheet, they are all ENERGY COSTS when we break them down to their simplest form.
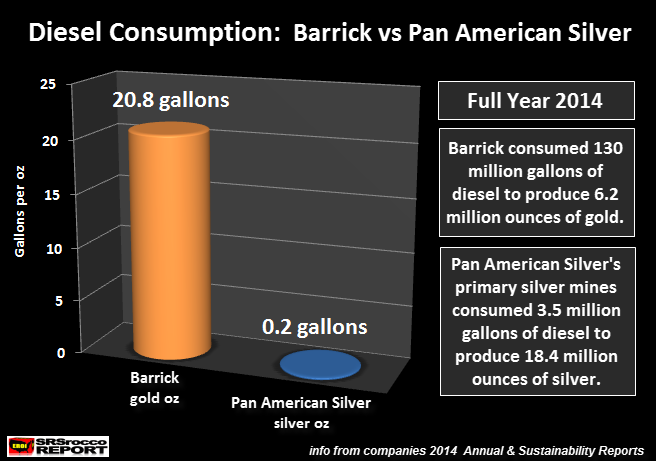
That being said, let’s look at the huge difference in the consumption of diesel in the primary gold and silver mining industry. I selected Barrick because they are the largest gold producer in the world and Pan American Silver is one of the largest primary silver mining companies. While other companies such as Fresnillo located in Mexico produce more silver than Pan American Silver, I was able to obtain diesel consumption data from Pan American Silver more readily as they just released their 2014 Sustainability Report.
If we look at the chart below, we can see just how much more diesel is consumed in the production of gold than silver:
According to the data from the two companies 2014 Sustainability Reports, Barrick consumed 20.8 gallons of diesel to produce an ounce of gold while Pan American Silver only used 0.2 gallons to yield an ounce of silver. Basically, it took Barrick 100 times more diesel to produce an ounce of gold in 2014 than it took Pan American Silver to produce an ounce of silver.
That said, let me clarify a few things. First, these mining companies state their energy consumption figures in various metrics. For example, Barrick listed their energy consumption in giga joules and Pan American Silver in cubic meters. So, we have to make some conversions to gallons to make a comparison.
SGTreport – The Corporate Propaganda Antidote – Silver, Gold, Truth, Liberty, & Freedom