by Michael Snyder, The Economic Collapse Blog:
 I have never done anything like this before. Ever since I started The Economic Collapse Blog in late 2009, I have never issued any kind of “red alert” for any specific period of time. As an attorney, I was trained to be level-headed and to only come to conclusions that were warranted by the evidence. So this is not something that I am doing lightly. Based on information that I have received, things that I have been told, and thousands of hours of research that have gone into the publication of more than 1,300 articles about our ongoing economic collapse, I have come to the conclusion that a major financial collapse is imminent. Therefore, I am issuing a RED ALERT for the last six months of 2015.
To clarify, when I say “imminent” I do not mean that it will happen within the next 48 hours. And I am not saying that our problems will be “over” once we get to the end of 2015. In fact, I believe that the truth is that our problems will only be just beginning as we enter 2016.
What I am attempting to communicate is that we are right at the door of a major turning point. About this time of the year back in 2008, my wife and I went to visit her parents. As we sat in their living room, I explained to them that we were on the verge of a major financial crisis, and of course the events that happened a few months later showed that I was right on the money.
Read More @ theeconomiccollapseblog.com
This time around, I wish that I could visit the living rooms of all of my readers and explain to them why we are on the verge of another major financial crisis. Unfortunately, that is not possible, but hopefully this article will suffice. Please share it with your friends, your family and anyone else that you want to warn about what is coming.
Let’s start with a little discussion about the U.S. economy. Most of the time, when I use the term “economic collapse” what most people are actually thinking of is a “financial collapse”. And we will talk about the imminent “financial collapse” later on in this article. But just because stocks have recently been hitting all-time record highs does not mean that the overall economy has been doing well. This is a theme that I have hammered on over and over again. It is my contention that we are in the midst of a long-term economic collapse that has been happening for many years, that is happening as you read this article, and that will greatly accelerate over the coming months.
Let me give you just one quick example. When an economy is healthy, money tends to circulate fairly rapidly. I buy something from you, then you take that money and buy something from someone else, etc. In a stable and growing economy, people generally feel good about things and they are not afraid to spend. But during hard times, the exact opposite happens. That is why the velocity of money almost always slows down during a recession. As you can see from the chart below, the velocity of money has indeed gone down during every recession since 1960. Once a recession is over, the velocity of money is supposed to go back up. But a funny thing happened after the last recession ended. The velocity of money continued to go down, and it has now hit an all-time record low…
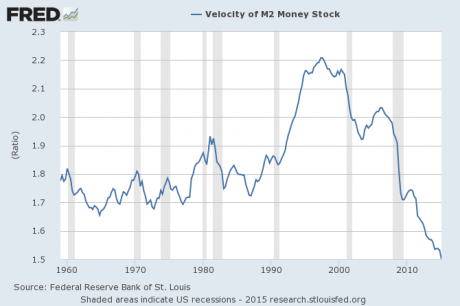
This is the kind of chart that you would expect from a very sick economy. And without a doubt, our economy is sick. Even the official government numbers paint a picture of an economy that is deeply troubled. Corporate profits have declined for two quarters in a row, U.S. exports plunged by 7.6 percent during the first quarter of 2015, U.S. GDP contracted by 0.7 percent during the first quarter, and factory orders have declined year over year for six months in a row.
If the stock market was connected to reality, it would be going down. But instead, it has just kept going up. As I discussed yesterday, this is a classic case of an irrational financial bubble. If I was writing an economic textbook and I wanted to include an example of what a run up to a major financial crash looks like, it would be hard to come up with anything more ideal than what we have watched unfold over the last six months. Just about every pattern that has popped up prior to previous stock markets crashes is happening again, and this is something that I have written about so much that many of my readers are sick of it.
And without a doubt, our financial markets are primed for a crash.
Only two times before has the S&P 500 been up by more than 200 percent over a six year time frame.
The first was in 1929, and the stock market subsequently crashed.
The second was in 2000, right before the dotcom bubble burst.
And by just about any measure that you can possibly imagine, stocks are massively overvalued right now.
For instance, just check out the chart posted below. It comes from Doug Short, and it shows that the ratio of corporate equity prices to GDP has only been higher one time since 1950. That was in 2000 just before the dotcom bubble burst…

Let’s take a look at another chart. This one comes from Phoenix Capital Research, and it shows that the CAPE ratio (cyclically adjusted price-to-earnings ratio) has rarely been higher. In fact, the only times that it has been higher we have seen stock market crashes immediately afterwards…
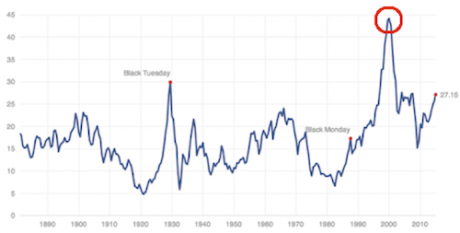
Yale economics professor Robert Shiller is also deeply concerned about the CAPE ratio…
I think that compared with history, US stocks are overvalued. One way to assess this is by looking at the CAPE (cyclically adjusted P/E) ratio that I created with John Campbell, now at Harvard, 25 years ago. The ratio is defined as the real stock price (using the S&P Composite Stock Price Index deflated by the CPI) divided by the ten-year average of real earnings per share. We have found this ratio to be a good predictor of subsequent stock market returns, especially over the long run. The CAPE ratio has recently been around 27, which is quite high by US historical standards. The only other times it has been that high or higher were in 1929, 2000, and 2007—all moments before market crashes.
But the CAPE ratio is not the only metric I watch. In my bookIrrational Exuberance (3rd Ed., Princeton 2015) I discuss several metrics that help judge what’s going on in the market. These include my stock market confidence indices. One of the indicators in that series is based on a single question that I have asked individual and institutional investors over the years along the lines of, “Do you think the stock market is overvalued, undervalued, or about right?” Lately, what I call “valuation confidence” captured by this question has been on a downward trend, and for individual investors recently reached its lowest point since the stock market peak in 2000.
Other valuation indicators produce similar results. This next chart is another one from Doug Short, and it shows the average of four of his favorite valuation indicators. As you can see, there is only one other time when stocks have been more overvalued than they are today according to the average of his four favorite indicators, and that was just before the stock market crashed when the dotcom bubble burst…
SGTreport – The Corporate Propaganda Antidote – Silver, Gold, Truth, Liberty, & Freedom